
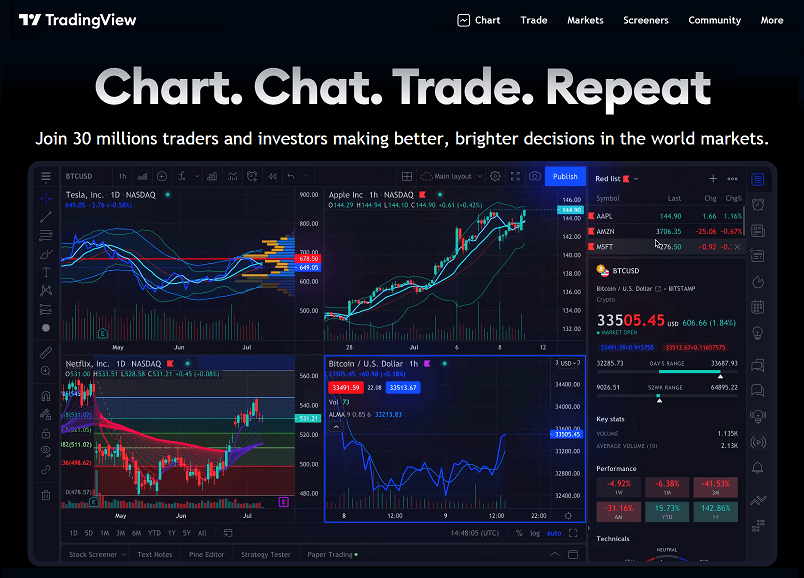
Before you start trading in cryptocurrencies, you have to look at the price charts. Some people check for abnormalities or vivid fluctuations in the charts, while others conduct technical analysis by drawing resistance and support lines to find the right entry-level.
The second kind of trader needs some sort of tool to do the analysis, and TradingView helps with that. TradingView is an online platform with price charts for almost anything, including crypto.
The prices in the TradingView charts are updated in real-time to provide you with the most accurate and current information out there. It is also equipped with lots of different tools to do the most . For crypto traders on TradingView who love technical analysis, accurate and robust charting tools are essential. TradingView is available to both amateurs and professionals with several trading and charting tools. It also has a free membership option, unlike other charting tools.
If you’ve been trading in Tradeview, you might have already noticed that TradingView’s tools are available on the exchange. But without knowing and understanding them, it can look quite intimidating and confusing. There are lots of things to try out in TradingView, and the best place to start is to dive into this rich beginner-friendly guide to understanding and using TradingView.
What is TradingView and what does it do for crypto trading?
TradingView is a platform that lets you customize technical indicators, analyze financial assets and create charts. It’s a charting service and a social network for investors and traders. The technical indicators are patterns, shapes, and lines that millions of traders use every day.
TradingView provides charts to allow users to observe and monitor the price charts of hundreds of assets, including cryptocurrencies, and share and discuss crypto trading ideas about the market. The indicators are a key part of technical analysis that provide traders with highly sought-after degrees of price predictability on volatile markets such as crypto.
TradingView doesn’t require you to download a client since it is entirely browser-based . You also have the option to download an app for Android and iOS if you prefer a mobile experience.
How costly is TradingView?
As mentioned before, TradingView is free to use for anyone. But there are also paid subscriptions that increase the number of charts and indicators you can view simultaneously.
For beginners, a free account with two indicators and one TradingView chart would be a good start. Although you’ll have to tolerate the adverts, they aren’t that intrusive, and you get an overall decent experience of it on Tradingview.
Below you see the three kinds of subscriptions that TradingView offers other than the free one.
TradingView’s Social Network
TradingView features an Instagram-like environment for sharing and showing off trading strategies and ideas. TradingView’s Ideas and Streams pages provide you the ability to pick up tips or get feedback.
If you start browsing the Ideas page you’ll be able to see TradingView charts, commentaries, and videos from other users. Members of the community can also get involved in chat rooms and discussions. Just like Twitch, TradingView Streams lets you see other traders create charts in real-time.
Getting to know the Tradingview UI
If you don’t have any experience with charting tools, then TradingView can look confusing to you. So let’s break it down first.
Toolbar 1
This toolbar houses all the charting and drawing tools that you can use directly in the chart area. From simple lines to long and short positions, there are a lot of things you can find there. You can also right-click every tool to see an extended selection. Although some are more advanced than others, the default lineup has enough basics to get started.
Toolbar 2
In this toolbar, you can find options to change the look of the chart. You are able to choose between line graphs, candlesticks, area graphs, and many more. In this section, there is also a search bar to the left to change the displayed asset. Another tool to remember is the “Indicator &Strategies” button to insert premade analysis pattern such as a moving average.
Toolbar 3
Since TradingView doesn’t offer a brokerage service, you can trade within the website using the “Trading Panel” tab. You can find a list of partners you can exchange with if you already possess an open account with them. Also, you can backtest your strategies using the “Strategy Tester” function.
Toolbar 4
This section mainly contains news and the platform’s social elements. You are able to customize your watchlist, privately text with other users, access a personalized calendar, and explore Ideas and Streams. This area can be used to find any data, information, or lists.
Chart Area
When you start changing the asset you’re looking at, using any of the tools or place indicators, you will find them displayed in the main chart section. You are also able to customize almost anything you see, which we’ll discuss in more detail in the next section.
TradingView Charts Personalization for Crypto Trading
Every trader has their preferences when it comes to charts. Customizing lines, colors, and axes makes it simpler to read and understand the graphs quickly. You will find all the options you need by right-clicking the graph area and selecting “Settings” on tradingview, where you can see the TradingView section.
You are also able to reset your TradingView chart from the “Settings” menu if it gets messy and also if you want to set custom email price alerts.
Once you click the “Settings” button you’ll find yourself in the “Chart Settings” area where you can mess around with a bunch of options. Let’s go through some of the basics involved.
- Symbol – Let’s you change the manner in which your candlestick charts look, where every part of the candlestick pattern can be color-coded in the way you like.
- Events – This gives you the option to see splits, dividends, and other events in the chart section.
- Appearance – Let’s you change the background color, axes, gridlines, and other cosmetic characteristics.
- Status Line – It contains options to change the data you’ll find in the top left of the chart, such as open, high, low, and close prices data and buy and sell buttons.
- Trading – This option allows you to customize visual elements if you’re using a broker account.
- Scales – This section provides you the option to change the trackers you see on the right-hand axis.
Once you are done customizing, there’s no need to save it manually since TradingView saves everything in real-time, for which you can log out anytime and come back later to them.
Pitchfork and Trend Line Features on TradingView Charts
Now let’s explore the implementation of technical indicators on the TradingView by charting a simple trend line.
- Select the trend line tool from the leftmost toolbar.
- Try using the “Magnet Mode” which will make your indicators snap automatically to the nearest candlestick elements.
- Now, you just need to connect the highest points on the descending chart (peaks) or the lowest points in an uptrend (with throughs), which depends on whether you want to locate support or a resistance line. In this case, you can see the highlighted support line from which the price tends to jump upwards. It is a useful indicator when you’re looking to identify the best moments to buy an asset.
Here’s another example, Alan Andrew’s Pitchfork, which is a more complex and advanced three-point indicator.
- Pick the “Pitchfork Tool” from the leftmost toolbar.
- Place the first point of the tool at the start of an uptrend or downtrend.
- Now, place the second point at the high-reaction point of your trend.
- Lastly, place the third point at the low-reaction point of the trend.
The resulting pitchfork-like shape offers a trader insight and indications of the general direction of the trend, its support, and resistance lines. It is crucial to keep in mind that placing all three points of a pitchfork correctly requires a good amount of experience. Basically, indicator-based price predictions are best when combined with multiple different technical indicators, therefore don’t just depend on one tool in your technical analysis.
TradingView for Crypto: Final Thoughts
For any trader looking for a free and competent solution with a great number of useful tools, TradingView is a solid option both for beginners and experienced traders. TradingView’s educational materials are also free to access and cover all the necessary basics of charting and technical analysis in detail.
TradingView is a considerably simple and cheaper platform for a complete novice. Also, the integrated social network helps newcomers learn the ropes of technical analysis and trading, but always be careful to take the advice and suggestions in the social section with a grain of salt.
All in all, the TradingView section is definitely worth checking out if you want to try chart tools and also don’t want to spend too much of your money on the platform itself.

